
Who knew there could be so much to glean from that little CO₂ waveform tucked away on your ICU monitor?! This week on Critical Care Time, Cyrus and Nick return to Back to Basics and unpack end-tidal CO₂ and capnography—from the fundamentals to advanced bedside interpretation. We explore seven practical uses for capnography, including confirming tube placement, monitoring sedation, and guiding resuscitation, before digging into the physiology connecting metabolism, perfusion, and ventilation. Along the way, we explain why end-tidal and arterial CO₂ don’t always agree, decode shark-fin waveforms and other revealing patterns, and troubleshoot the equipment issues that can lead you astray. Whether you’re new to the ICU or looking to sharpen your skills, join us for practical bedside pearls, a healthy dose of physiology, and a surprisingly relevant detour into the world of seals, manatees, and “nature’s CO₂ retainers.” Buckle up! Once you are off the ride - shoot us a message or leave us a review and let us know how we’re doing!
About the B2B series
The Back to Basics (B2B) series takes a piece of equipment we use — and take for granted — every day in the ICU and breaks it down at three levels:
101 — foundational knowledge for people new to the ICU (medical students, nursing students)
201 — the "why behind the what" for people who already know the device
301 — advanced tricks, edge cases, and myth-busting for experienced clinicians
This episode: pulse oximetry, the free, continuous, non-invasive vital sign we all rely on and almost never think critically about.
Capnography: 101, 201, and 301
Critical Care Time | Episode Show Notes
Capnography is one of the most useful—and underappreciated—monitoring tools in critical care. Although most clinicians associate end-tidal CO₂ (ETCO₂) with confirming endotracheal tube placement, capnography provides much more information than simply whether a patient is breathing.
In this episode of Critical Care Time, Nick and Cyrus explore capnography in three progressively more advanced sections: Capnography 101, covering the technology and its essential clinical applications; ETCO₂ 201, exploring the physiology of CO₂ production, perfusion, ventilation, and dead space; and Capnography 301, examining how waveform morphology can reveal specific pathophysiologic processes.
Along the way, we discuss why a color-changing CO₂ detector can be misleading, how to interpret ETCO₂ during cardiac arrest, why the PaCO₂–ETCO₂ gradient matters, how to recognize abnormal capnograms, and what diving mammals and alligators can teach us about CO₂ physiology.
Part 1: Capnography 101
What is capnography?
Capnography refers to monitoring exhaled carbon dioxide, but three distinct technologies are commonly grouped under this term.
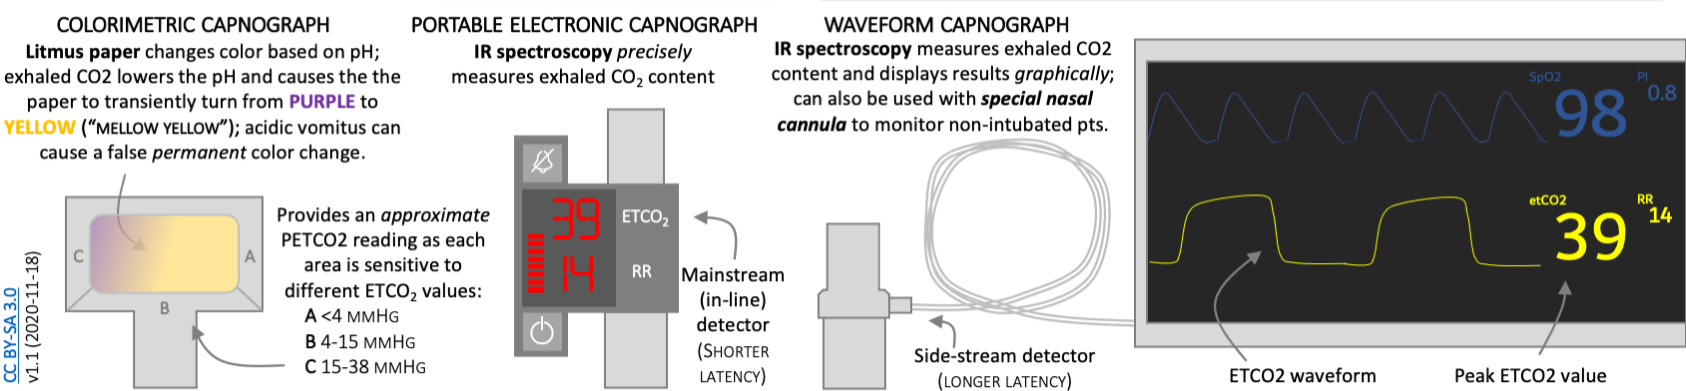
1. Qualitative colorimetric CO₂ detectors
Devices such as EasyCAP use pH-sensitive indicator paper that changes color when exposed to CO₂.
The indicator typically changes from purple to yellow as CO₂ concentration increases, leading to the mnemonic "mellow yellow."
They are inexpensive, disposable, and require no external power.
However, they provide neither a continuous quantitative measurement nor a waveform.
They are particularly vulnerable to misleading results in low-perfusion states or when contaminated by gastric contents.
2. Quantitative capnometry
Electronic monitoring that reports a numerical ETCO₂ value, generally in mmHg.
The displayed value represents CO₂ measured near the end of expiration.
Provides more precise measurement than a qualitative detector.
However, the absence of a waveform limits interpretation of respiratory patterns and waveform abnormalities.
3. Continuous waveform capnography
Displays both the numerical ETCO₂ value and a continuous tracing of exhaled CO₂.
Allows assessment of respiratory rate, waveform morphology, inspiratory baseline, and breath-to-breath changes.
Can identify abnormalities in ventilation, airway patency, pulmonary perfusion, and gas exchange.
Is the preferred technology for confirming and continuously monitoring endotracheal tube placement.
Key concept: ETCO₂ reflects the interaction of three physiological processes:
Metabolism: How much CO₂ is produced by the body's tissues.
Perfusion: How effectively blood delivers that CO₂ to the lungs.
Ventilation: How effectively the lungs eliminate CO₂.
A change in ETCO₂ can reflect a change in any of these processes, or some combination of them.
Seven reasons to use capnography in the ICU
1. Confirming endotracheal tube placement
One of the most important applications of capnography is confirming that an endotracheal tube has been placed in the trachea rather than the esophagus.
Unrecognized esophageal intubation is a preventable cause of severe hypoxemia, neurological injury, and death.
Continuous waveform capnography is recommended for confirming tracheal intubation.
Sustained exhaled CO₂, rather than a single positive reading, is the critical finding.
An initial transient CO₂ signal can occur after esophageal intubation if CO₂ is present in the stomach.
A severely reduced or absent ETCO₂ signal can also occur with a correctly positioned tube during profound circulatory failure.
The 2022 Project for Universal Management of Airways (PUMA) consensus guideline emphasizes sustained exhaled carbon dioxide as the primary method of excluding esophageal intubation.
When sustained exhaled CO₂ cannot be demonstrated, esophageal placement must be actively excluded. Tube removal is the default recommended response unless removal itself presents an immediate danger, in which case urgent confirmation by valid alternative techniques is required.
Clinical pearl: Seeing the tube pass through the cords is helpful, but it does not replace confirmation with sustained waveform capnography.
2. Recognizing accidental endotracheal tube dislodgement
Capnography is not only useful immediately after intubation. It provides continuous surveillance of tube position and ventilation.
An abrupt reduction or disappearance of the capnogram should raise concern for:
Accidental extubation or tube displacement.
Circuit disconnection.
Airway obstruction or mucus plugging.
Apnea or loss of delivered ventilation.
Severe reduction in pulmonary blood flow.
Sampling-system malfunction.
A tube displaced into the oropharynx may still produce a small or abnormal CO₂ signal, making waveform interpretation especially important.
A sudden loss of waveform requires immediate assessment of the patient, tube, circuit, ventilation, and circulation.
3. Improving safety during procedural sedation
Pulse oximetry measures oxygenation, not ventilation.
Patients receiving supplemental oxygen may maintain a normal SpO₂ despite prolonged hypoventilation or apnea. Consequently, relying on pulse oximetry alone may delay recognition of respiratory depression.
Capnography can identify the loss of exhaled CO₂ within the first missed breaths, potentially allowing intervention before clinically significant desaturation occurs.
This is especially relevant when using sedatives and analgesics such as:
Fentanyl and midazolam.
Propofol.
Ketamine combined with other respiratory depressants.
Other medications that impair respiratory drive or upper-airway patency.
The 2018 American Society of Anesthesiologists procedural sedation guidelines recommend continuous capnographic monitoring of ventilation during moderate sedation unless precluded or invalidated by the patient, procedure, or equipment.
Supporting evidence
A 2017 systematic review and meta-analysis of 13 randomized trials found that adding capnography to standard procedural sedation monitoring was associated with:
Reduced mild desaturation: RR 0.77 (95% CI 0.67–0.89).
Reduced severe desaturation: RR 0.59 (95% CI 0.43–0.81).
Reduced need for assisted ventilation: OR 0.47 (95% CI 0.23–0.95).
References:
4. Monitoring patients at risk of respiratory depression
Capnography can identify hypoventilation or apnea before oxygen saturation falls in patients receiving supplemental oxygen.
Potential applications include:
Patients receiving opioid patient-controlled analgesia (PCA).
Patients receiving continuous opioid infusions.
Selected postoperative patients at elevated risk for respiratory depression.
Patients with obstructive sleep apnea or obesity hypoventilation.
Patients being treated with naloxone infusions for opioid toxicity.
Selected neurologically impaired patients in whom respiratory status requires close surveillance.
A study of 634 postoperative patients receiving opioid PCA identified nine episodes of respiratory depression requiring intervention. In each case, capnography (not pulse oximetry!) provided the initial warning.
Although capnography improves recognition of respiratory abnormalities, evidence that routine ward monitoring prevents mortality or other major clinical outcomes remains less definitive.
5. Guiding resuscitation during cardiac arrest
During cardiopulmonary resuscitation, pulmonary blood flow is often the principal determinant of ETCO₂ when ventilation and CO₂ production remain relatively stable.
ETCO₂ monitoring can provide information about three important aspects of resuscitation.
A. Quality of chest compressions
ETCO₂ below 10 mmHg is generally associated with poor pulmonary blood flow and lower rates of return of spontaneous circulation (ROSC).
Values above 10 mmHg, and ideally above 20 mmHg, are associated with higher rates of ROSC.
Improvements in compression depth, release, and overall CPR quality may increase ETCO₂.
ETCO₂ is an indirect surrogate, not a definitive measure of CPR quality or cerebral perfusion.
B. Detection of ROSC
A sudden, sustained rise in ETCO₂ during chest compressions may indicate restoration of spontaneous circulation.
A rise greater than 10 mmHg has been described as suggestive of ROSC.
Smaller changes can also occur with ROSC.
Changes in ventilation, medications, airway management, and compression quality can affect the tracing.
C. Prognostication and termination of resuscitation
Persistently low ETCO₂ is associated with poor outcomes, but it must never be treated as an absolute prognostic test.
The 2025 AHA guidelines state that failure to achieve ETCO₂ greater than 10 mmHg after 20 minutes of advanced life support in an intubated adult may contribute to a multimodal decision about terminating resuscitation.
An isolated ETCO₂ threshold should not be used to terminate resuscitation, and specific ETCO₂ cutoffs should not be used for that purpose in nonintubated patients.
6. Identifying changes in pulmonary perfusion and dead space
ETCO₂ is influenced by the delivery of CO₂-containing blood to ventilated alveoli.
A reduction in pulmonary blood flow or an increase in alveolar dead space can cause ETCO₂ to fall, even when arterial PaCO₂ is unchanged or rising.
Important examples include:
Pulmonary embolism.
Abrupt reduction in cardiac output.
Severe hypotension or shock.
Cardiac arrest.
Excessive PEEP or alveolar overdistension, when these impair alveolar perfusion.
The relationship between arterial CO₂ and exhaled CO₂ is explored in greater detail in the 201 section.
7. Recognizing specific pathophysiological states from the waveform
Capnography provides a continuous graphical representation of expired CO₂, and its morphology can offer valuable clues to respiratory mechanics and gas exchange.
Characteristic patterns may suggest:
Bronchospasm or obstructive lung disease.
Heterogeneous lung emptying.
Endobronchial intubation.
Rebreathing.
Spontaneous respiratory efforts during mechanical ventilation.
Cardiac oscillations.
Changes in pulmonary perfusion.
These patterns are explored in the 301 section.
Why qualitative CO₂ detectors can be misleading
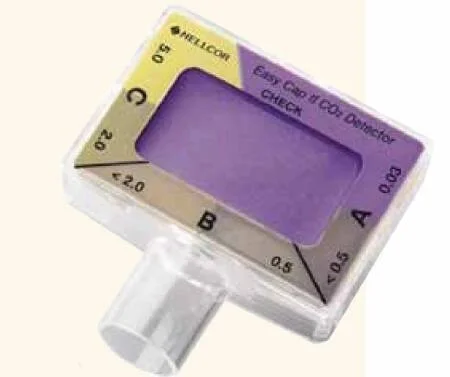
Although inexpensive and widely available, colorimetric detectors have important limitations.
False negatives: low CO₂ delivery
Colorimetric detectors require sufficient CO₂ to produce an obvious color change.
For EasyCAP II, the approximate interpretation ranges are:
Exhaled CO₂Indicator appearanceLess than 0.5% (approximately 4 mmHg)Purple0.5–2% (approximately 4–15 mmHg)Tan / intermediate2–5% (approximately 15–38 mmHg)Yellow
During cardiac arrest or profound shock, reduced pulmonary blood flow can limit the amount of CO₂ delivered to ventilated alveoli. As a result, a correctly positioned ETT may produce little or no color change.
In one observational study of emergency intubations, colorimetric detector sensitivity was approximately 62% in cardiac arrest, compared with 98% in patients intubated for respiratory failure.
False positives: gastric contents and carbonated beverages
Acidic gastric contents may directly change the color of the indicator paper.
CO₂ retained in the stomach can produce transient positive readings following esophageal intubation.
Carbonated beverages have also been shown to produce misleading colorimetric results in simulation experiments.
A 2009 simulation study demonstrated false-positive readings following simulated esophageal intubation when carbonated beverages were present in the gastric compartment.
If a colorimetric detector must be used:
Follow the manufacturer's instructions, including assessment after six ventilations.
Look for a reproducible inspiratory-to-expiratory color change, not simply a persistent yellow indicator.
Recognize that low perfusion can produce false-negative results.
Do not allow an apparently positive colorimetric result to override strong evidence of incorrect tube placement.
Use continuous waveform capnography whenever available.
Bottom line: Colorimetric CO₂ detection is better than having no CO₂ detection, but it is not interchangeable with continuous waveform capnography!
References:
Preventing unrecognized esophageal intubation in the emergency department.
False-positive colorimetric capnometry after ingestion of carbonated beverages.
Part 2: End-Tidal CO₂ 201
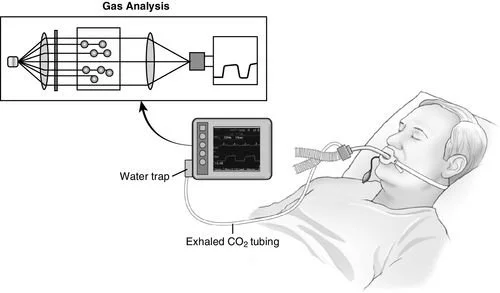
How does quantitative capnography work?
Most conventional electronic capnographs measure CO₂ using infrared absorption spectroscopy.
Carbon dioxide strongly absorbs infrared radiation at approximately 4.26 micrometers (4,260 nm).
The device passes infrared light through a sample of respiratory gas and measures how much light is absorbed. The measured absorption is used to determine CO₂ concentration.
There are two principal sampling configurations.
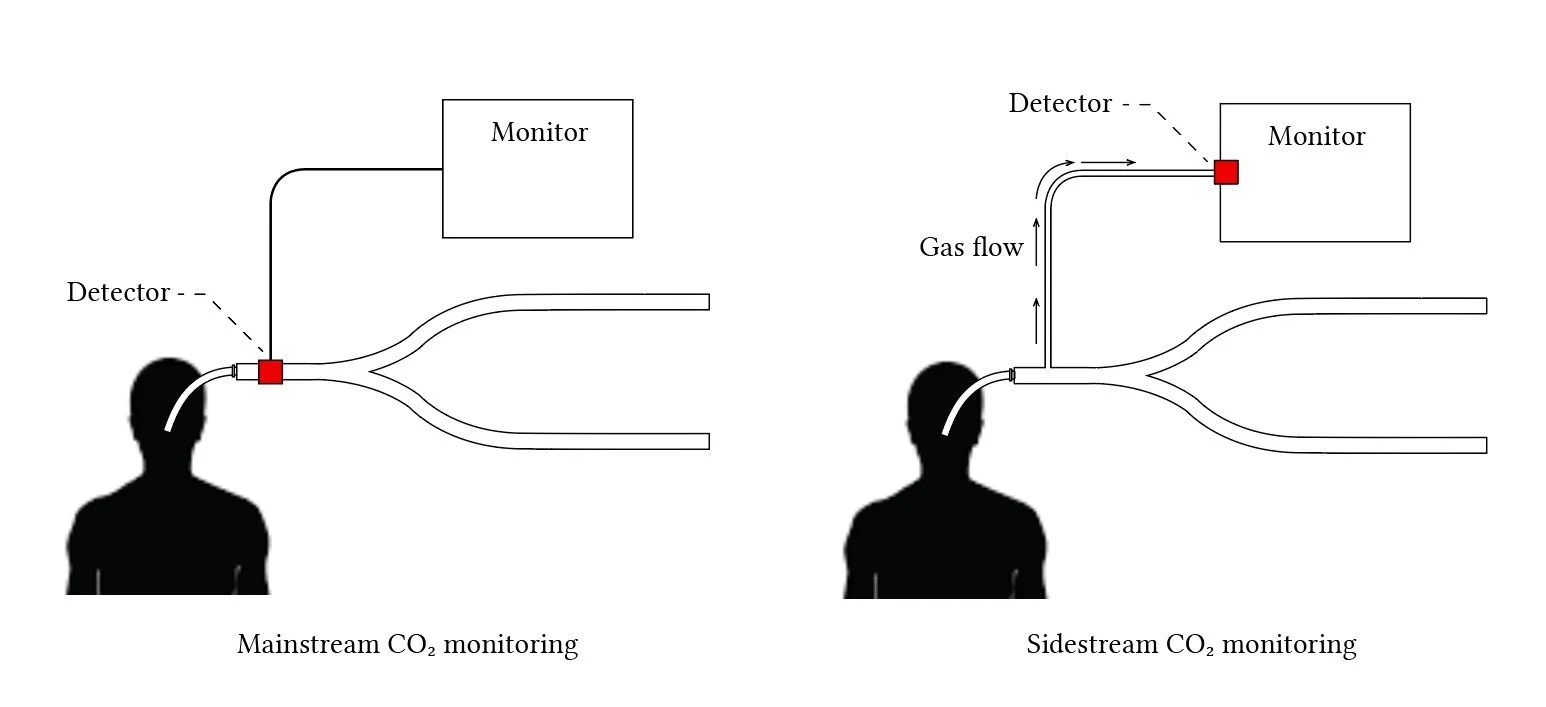
Mainstream vs sidestream sampling
Source: Deranged Physiology
Mainstream capnography
The sensor is placed directly in the airway circuit, typically near the ETT.
Measures CO₂ without transporting gas through a sampling tube.
Offers rapid response with minimal sampling delay.
Can add weight and apparatus dead space to the airway circuit.
Sidestream capnography
Continuously aspirates a small volume of gas through a sampling line.
The sensor is located away from the patient's airway.
Allows monitoring using nasal cannulas and other sampling interfaces.
Introduces a sampling delay and can be affected by tubing obstruction, condensation, dilution, or leaks.
Both systems use similar principles, but their physical configurations influence accuracy, response time, and susceptibility to artifact.
Reference: Jaffe. Respiratory Gas Analysis—Technical Aspects. Anesthesia & Analgesia, 2018.
Interpreting ETCO₂: Metabolism, perfusion, and ventilation
ETCO₂ is best understood as the result of three interacting processes.
ProcessIncreased activityDecreased activityCO₂ productionMay increase ETCO₂May decrease ETCO₂Pulmonary perfusionMay increase ETCO₂May decrease ETCO₂Alveolar ventilationUsually decreases ETCO₂Usually increases ETCO₂
These relationships assume the other determinants remain reasonably stable.
Causes of increased ETCO₂
Hypoventilation or reduced minute ventilation.
Increased metabolic CO₂ production from fever, shivering, or seizures.
Malignant hyperthermia.
Increased delivery of CO₂ to the lungs following improved circulation or ROSC.
CO₂ rebreathing.
Causes of decreased ETCO₂
Hyperventilation.
Reduced cardiac output or pulmonary perfusion.
Pulmonary embolism.
Increased alveolar dead space.
Reduced metabolic CO₂ production.
Airway or breathing-circuit interruption.
In malignant hyperthermia, an otherwise unexplained increase in ETCO₂ may be an early and important physiological clue, often preceding marked hyperthermia.
Reference: Association of Anaesthetists. Malignant hyperthermia, 2020.
The relationship between PaCO₂ and ETCO₂
Arterial carbon dioxide tension (PaCO₂) and end-tidal carbon dioxide (ETCO₂) are closely related but are not interchangeable.
In healthy lungs, PaCO₂ is typically slightly higher than ETCO₂, often by approximately 2–5 mmHg.
The difference is called the arterial-to-end-tidal CO₂ gradient:
P(a−ET)CO₂ = PaCO₂ − ETCO₂
For example:
PaCO₂ = 40 mmHg
ETCO₂ = 36 mmHg
Arterial-to-end-tidal gradient = 4 mmHg
This gradient is partly attributable to ventilation-perfusion heterogeneity and the contribution of poorly perfused lung units to exhaled gas.
In critical illness, the gradient may increase substantially and cannot be assumed to remain 2–5 mmHg.
Although PaCO₂ is generally greater than ETCO₂, negative gradients occasionally occur, particularly under certain anesthetic and physiological conditions.
Reference: Negative arterial-to-end-tidal carbon dioxide gradient during malignant hyperthermia.
Understanding physiological dead space
Dead space refers to portions of ventilation that do not effectively participate in gas exchange.
There are two principal components.
Anatomic dead space
Gas within the conducting airways.
Does not reach gas-exchanging alveoli.
Approximately 150 mL in a typical adult, although this varies with body size and airway anatomy.
Alveolar dead space
Gas reaching alveoli that receive insufficient pulmonary perfusion.
Can increase with pulmonary vascular obstruction, low cardiac output, or alveolar overdistension.
Total physiological dead space includes both components.
In healthy adults, physiological dead space is commonly approximately 25–35% of tidal volume, with most attributable to the conducting airways.
The Bohr equation
The classic Bohr equation describes the relationship between alveolar CO₂, mixed expired CO₂, and physiological dead space.
VD/VT = (PACO₂ − PĒCO₂) / PACO₂
Where:
VD = physiological dead-space volume.
VT = tidal volume.
PACO₂ = mean alveolar CO₂ tension.
PĒCO₂ = mixed expired CO₂ tension averaged across the entire exhaled breath.
The key distinction is that mixed expired CO₂ is not the same as end-tidal CO₂.
End-tidal CO₂ measures the gas near the end of expiration, whereas mixed expired CO₂ represents the volume-weighted average of the entire expiration.
The latter includes early expired gas originating from anatomical dead space and therefore has a lower CO₂ concentration.
The Enghoff modification
Because mean alveolar CO₂ tension is difficult to measure directly, Enghoff proposed substituting arterial PaCO₂ for PACO₂.
VD/VT = (PaCO₂ − PĒCO₂) / PaCO₂
This modification is widely used clinically.
However, the substitution introduces an important distinction: the Enghoff measurement reflects broader gas-exchange inefficiency, incorporating effects of V/Q mismatch and shunt in addition to true dead space.
Can ETCO₂ estimate dead space?
The short answer is yes. A simplified approximation we use at the bedside is:
(PaCO₂ − ETCO₂) / PaCO₂
This is a convenient index of the arterial-to-end-tidal gradient, but it is not equivalent to formal Bohr or Enghoff dead-space measurement.
Because ETCO₂ is generally higher than mixed expired CO₂, substituting ETCO₂ into the equation tends to underestimate the true physiological dead-space fraction.
For example:
PaCO₂ = 40 mmHg.
ETCO₂ = 36 mmHg.
The simplified ratio is (40 − 36)/40 = 0.10.
This does not imply that physiological dead space is only 10%. A healthy patient may have a physiological dead-space fraction closer to 0.30 despite this relatively small arterial-to-end-tidal difference.
Accurate dead-space measurement requires mixed expired CO₂, which can be obtained using volumetric capnography.
Reference: Volumetric capnography: lessons from the past and current clinical applications.
Why the PaCO₂–ETCO₂ gradient matters
When alveolar perfusion decreases, ventilated lung units may receive less CO₂-rich blood.
This can decrease exhaled CO₂ relative to arterial CO₂, widening the arterial-to-end-tidal gradient.
Situations associated with an increased gradient include:
Pulmonary embolism: Obstruction of the pulmonary vasculature produces regions of ventilated but poorly perfused alveoli.
Low cardiac output: Reduced blood flow to the lungs decreases delivery of CO₂ to the alveoli.
Excessive PEEP or overdistension: Elevated alveolar pressure may impair perfusion through some pulmonary capillaries, increasing alveolar dead space.
Severe pulmonary disease: Heterogeneous ventilation and perfusion can produce substantial differences between arterial and end-tidal CO₂.
Clinical example
A mechanically ventilated patient initially has:
PaCO₂ = 40 mmHg.
ETCO₂ = 36 mmHg.
Gradient = 4 mmHg.
Following an acute hemodynamic deterioration:
PaCO₂ = 45 mmHg.
ETCO₂ = 22 mmHg.
Gradient = 23 mmHg.
The marked widening of the gradient suggests a significant deterioration in pulmonary gas exchange or perfusion. Potential explanations include pulmonary embolism, reduced cardiac output, or overdistension.
It does not establish a specific diagnosis.
Critical assumption: When interpreting changes in ETCO₂ as changes in pulmonary blood flow, ventilation should remain reasonably constant.
If a patient's respiratory rate or tidal volume changes substantially, ETCO₂ may change independently of perfusion.
Practical takeaway: Compare ETCO₂ with measured PaCO₂ rather than assuming they are interchangeable. A widening gradient can provide an important clue to deteriorating cardiopulmonary physiology.
Limitations of nasal ETCO₂ monitoring
In spontaneously breathing patients, nasal sidestream ETCO₂ may be more useful as a continuous trend and respiratory-rate monitor than as a precise estimate of PaCO₂.
Measurement can be affected by:
Mouth breathing.
High supplemental oxygen flow.
Sampling-cannula position.
Inadequate exhaled tidal volume.
Rapid respiratory rate.
Leaks and dilution of the sample.
When an accurate PaCO₂ measurement is clinically necessary—for example, when evaluating suspected severe hypercapnia—obtain a blood gas rather than relying exclusively on nasal ETCO₂.
Part 3: Capnography 301
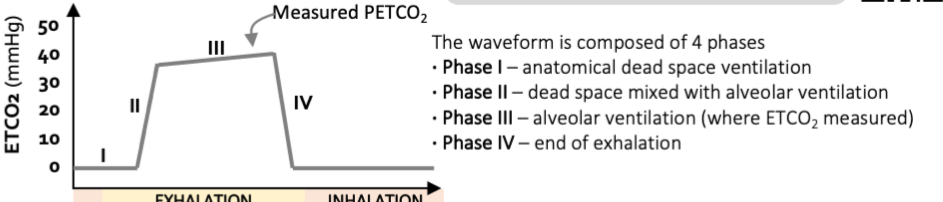
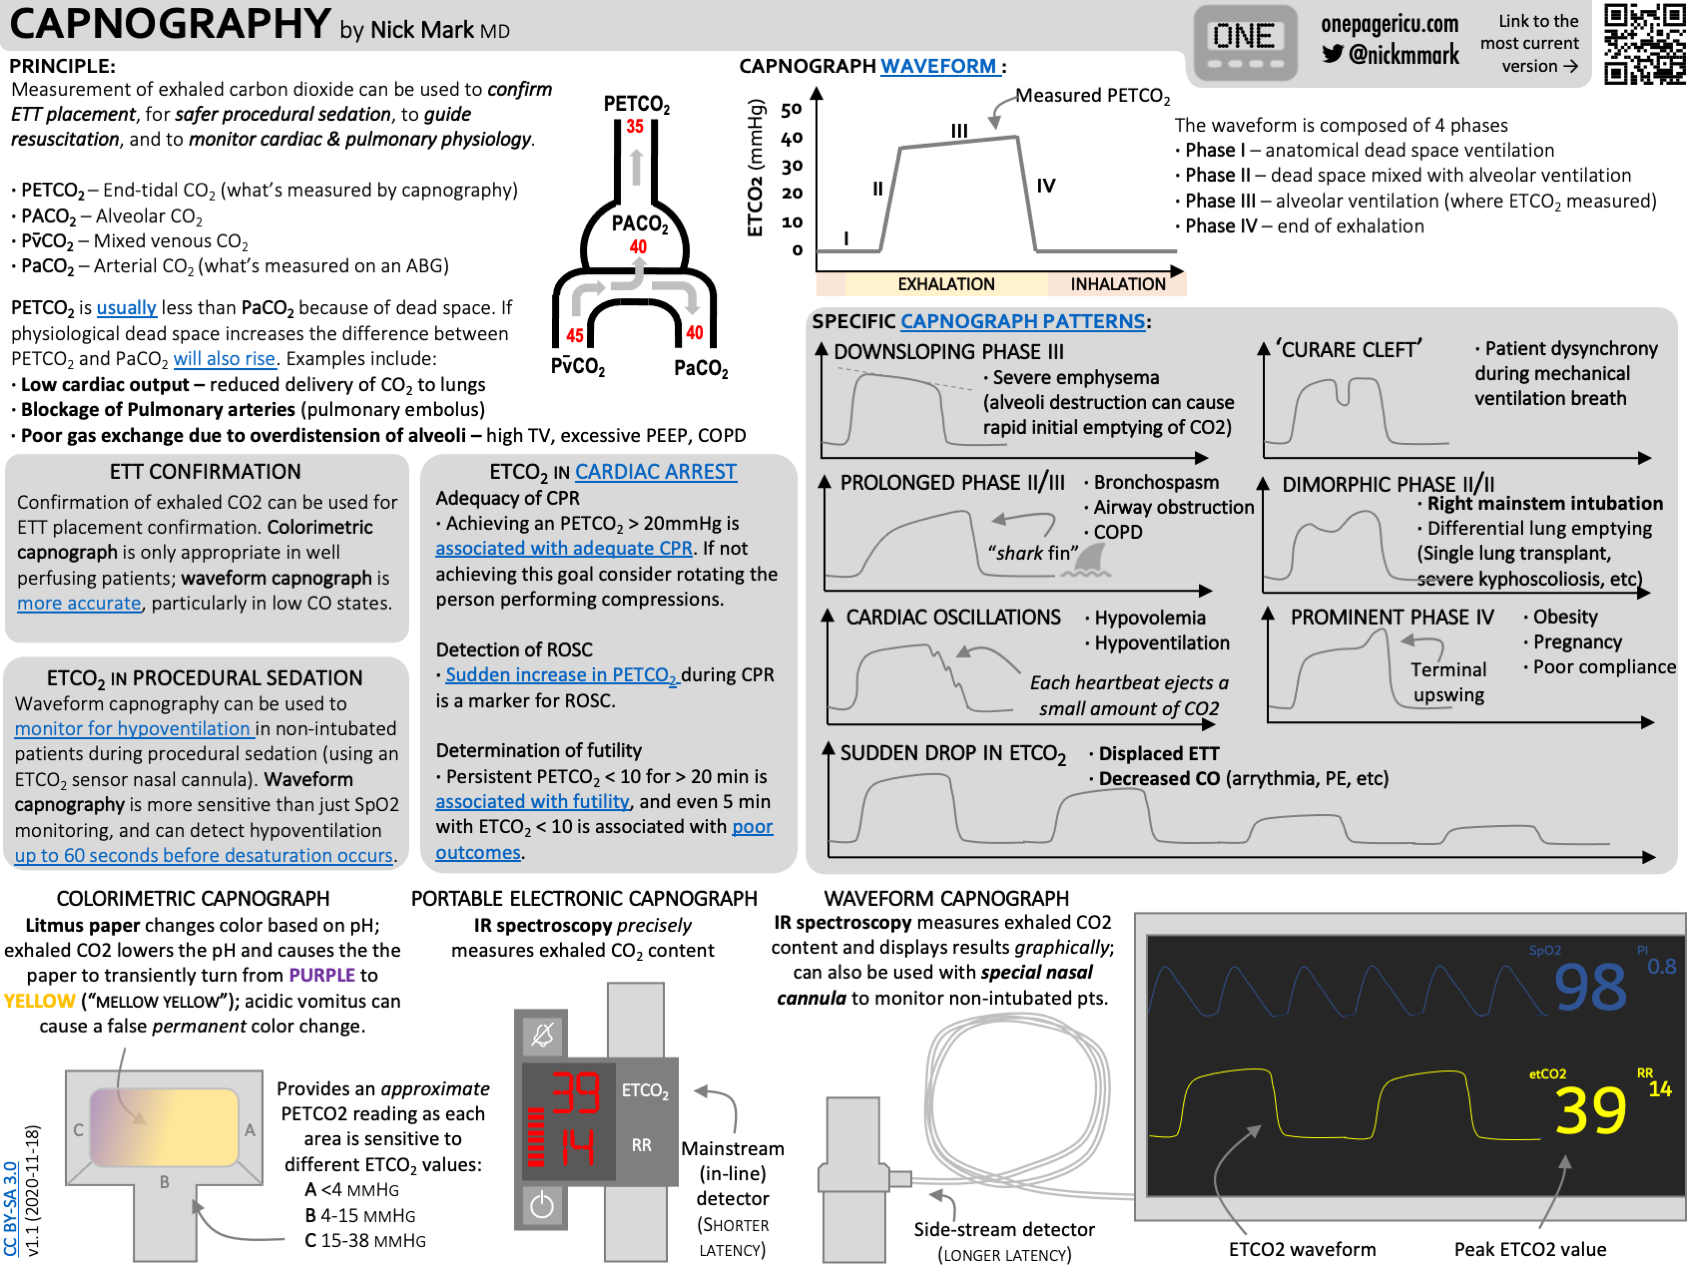
Understanding the normal capnogram
A normal time-based capnogram includes three principal expiratory phases followed by an inspiratory downstroke.
Phase I: Anatomic dead-space expiration
The beginning of expiration.
Gas originates primarily from the conducting airways.
Contains little or no CO₂, producing a near-zero baseline.
Phase II: Expiratory upstroke
Transition between anatomic dead-space gas and alveolar gas.
CO₂ concentration rises rapidly as alveolar gas reaches the sampling site.
The slope and duration can be influenced by airway resistance and heterogeneity of lung emptying.
Phase III: Alveolar plateau
Represents predominantly alveolar gas.
Usually has a relatively flat but slightly ascending slope.
ETCO₂ is measured near the end of phase III.
Changes in slope can reflect differences in alveolar emptying and ventilation-perfusion relationships.
Phase 0: Inspiratory downstroke
The rapid decline in measured CO₂ as fresh gas enters the airway.
Normally returns to approximately zero.
The conventional nomenclature uses phase 0 for inspiration. Some descriptions additionally recognize a phase IV, referring to a terminal upswing at the end of phase III.
[Figure 1 placeholder: Normal capnogram showing phases I, II, III, and 0, with the ETCO₂ measurement identified at the end of phase III.]
Abnormal capnography waveforms
1. Shark-fin waveform: Bronchospasm and airway obstruction
Appearance
Prolonged phase II upstroke.
Sloping or poorly defined phase III plateau.
Triangular or "shark-fin" expiratory morphology.
Physiology
Airway obstruction causes different lung regions to empty at different rates.
Some alveoli empty relatively quickly, while others with greater airway resistance require more time. This produces a prolonged transition and an upward-sloping expiratory waveform.
Clinical associations
Asthma exacerbation.
COPD.
Bronchospasm.
Other conditions causing expiratory airflow obstruction.
The morphology can provide information about the presence of airflow obstruction and its response to treatment, although it does not independently establish the diagnosis or severity.
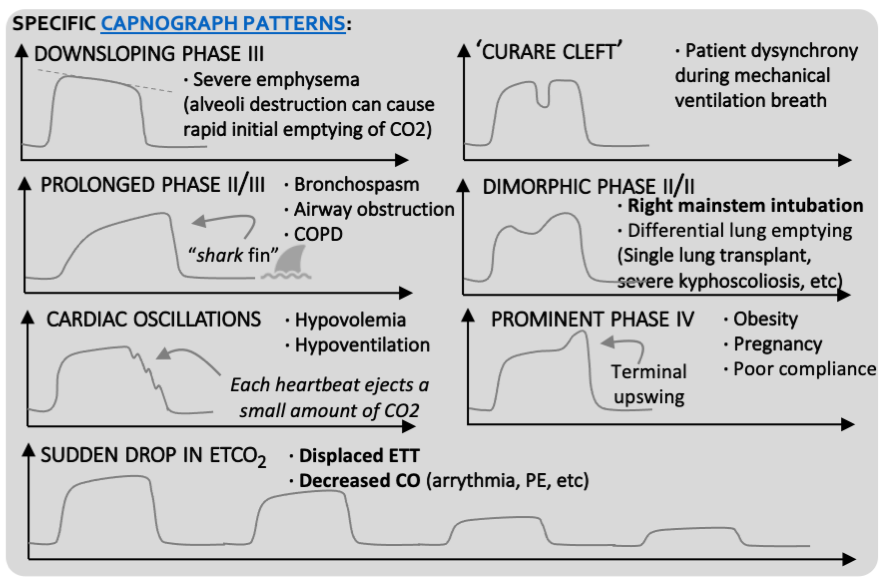
2. Dimorphic or biphasic capnogram
Appearance
Two distinct components or peaks during expiration.
An abnormal, biphasic phase II/III morphology.
Physiology
The waveform reflects two populations of lung units emptying at substantially different rates.
One group may empty rapidly while another empties more slowly, creating a second expiratory component.
Clinical associations
Right mainstem bronchial intubation in certain circumstances.
Single-lung transplantation.
Severe asymmetric lung disease.
Severe kyphoscoliosis.
Other conditions with markedly different regional lung mechanics.
A biphasic capnogram is not specific for endobronchial intubation, but it should prompt consideration of asymmetric ventilation and airway positioning.
References:
3. Reduced phase II slope
Appearance
More gradual phase II upstroke than expected.
Less distinct transition from dead-space gas to alveolar gas.
Physiology
The reduction in slope can reflect heterogeneous gas emptying or altered mixing of expired gases.
In severe emphysema, destruction of the normal alveolar architecture and heterogeneous time constants can contribute to abnormal expiratory waveform morphology.
This finding is not specific for emphysema and should be interpreted alongside airway mechanics, clinical context, and other monitoring data.
4. Cardiac oscillations
Appearance
Small rhythmic oscillations within the capnogram.
May correspond temporally to the patient's heartbeats.
Physiology
Mechanical movement of the heart and pulmonary structures can transmit small changes in gas flow to the airways, producing oscillations in the CO₂ tracing.
Cardiac oscillations may become prominent under certain conditions, including low tidal volumes and altered respiratory mechanics.
They can occasionally be mistaken for spontaneous breaths and may contribute to inappropriate ventilator triggering.
Although described in association with hypovolemia, cardiac oscillations are not a specific diagnostic marker of low circulating volume.
5. Prominent phase IV
Appearance
A steep terminal rise in CO₂ concentration near the end of phase III.
An exaggerated upswing just before inspiration.
Physiology
The terminal rise may reflect differences in regional alveolar emptying, particularly when slowly emptying units with higher CO₂ concentrations contribute disproportionately late in expiration.
Clinical associations
Obesity.
Pregnancy.
Reduced thoracic compliance.
Conditions producing markedly heterogeneous lung emptying.
This phenomenon is sometimes referred to as phase IV, although it is distinct from the conventional inspiratory phase 0.
Reference: Phase IV capnography: physiology and clinical associations.
6. Curare cleft: Spontaneous respiratory effort
Appearance
A notch or downward deflection in the alveolar plateau.
May appear during a mechanically delivered breath.
Physiology
A spontaneous inspiratory effort alters the measured exhaled CO₂ concentration during expiration.
Historically, this was called the curare cleft because it was observed when neuromuscular blockade began to wear off during anesthesia.
Clinical significance
Return of spontaneous respiratory effort.
Inadequate or waning neuromuscular blockade.
Patient-ventilator interaction or dyssynchrony.
A cleft is not specific for inadequate paralysis; it should prompt assessment of the patient and ventilator.
7. Elevated inspiratory baseline: CO₂ rebreathing
Appearance
The capnogram fails to return to zero during inspiration.
Persistent elevation of the inspiratory CO₂ baseline.
Possible causes
CO₂ rebreathing.
Malfunctioning breathing-circuit valves.
Inadequate fresh gas flow in certain anesthesia circuits.
Exhausted CO₂ absorbent in rebreathing systems.
Sampling-line contamination or measurement artifact.
An elevated inspiratory baseline should prompt evaluation of both the patient and equipment.
Using ETCO₂ to assess fluid responsiveness
ETCO₂ can serve as a surrogate for changes in cardiac output when ventilation and CO₂ production remain stable.
The physiological basis is straightforward: increasing cardiac output increases the delivery of CO₂-containing blood to the lungs, which may increase measured ETCO₂.
This has been studied during passive leg raising (PLR), which produces a reversible increase in venous return.
Clinical approach
Record baseline ETCO₂ while maintaining stable ventilation.
Perform a passive leg-raising maneuver.
Observe the change in ETCO₂.
Interpret an increase as potentially reflecting increased cardiac output.
Confirm fluid responsiveness using a direct or validated cardiac-output measurement when available.
Several studies have identified increases of approximately 5% or greater during PLR as predictive of fluid responsiveness in selected mechanically ventilated patients.
A systematic review and meta-analysis found that useful study-specific thresholds clustered around 5%, although diagnostic performance varied.
For perspective, an increase from 20 to 22 mmHg represents a 10% change.
Important limitations
Minute ventilation should remain stable.
CO₂ production should be reasonably constant.
The patient should have sufficient pulmonary blood flow for changes to be measurable.
Changes may be small and vulnerable to monitoring noise.
A rising ETCO₂ during PLR suggests a rise in cardiac output; it is not direct proof that a fluid bolus will improve clinically meaningful outcomes.
Practical tips for using capnography
Connecting capnography before intubation
Connecting waveform capnography before intubation ensures that confirmation is immediately available once the tube is placed.
Some monitors generate apnea alarms before ventilation begins. If these interfere with airway management, temporary alarm-silencing procedures should follow institutional monitoring policies, with appropriate immediate reactivation after airway placement.
Preventing sidestream condensation problems
Water condensation can obstruct the small sampling channels used in sidestream monitoring.
When monitoring becomes unreliable:
Inspect the sampling line and connector.
Evaluate for condensation, secretions, kinks, or disconnection.
Follow the device manufacturer's positioning and maintenance instructions.
Replace an obstructed or contaminated line when necessary.
Recognizing measurement artifact
Unexpected ETCO₂ readings should always be interpreted alongside:
Ventilator flow and pressure waveforms.
Respiratory rate.
Tidal volume and minute ventilation.
Blood pressure and other measures of perfusion.
Arterial blood gas measurements when available.
An unexpected number is a reason to investigate, not automatically a reason to change ventilator settings.
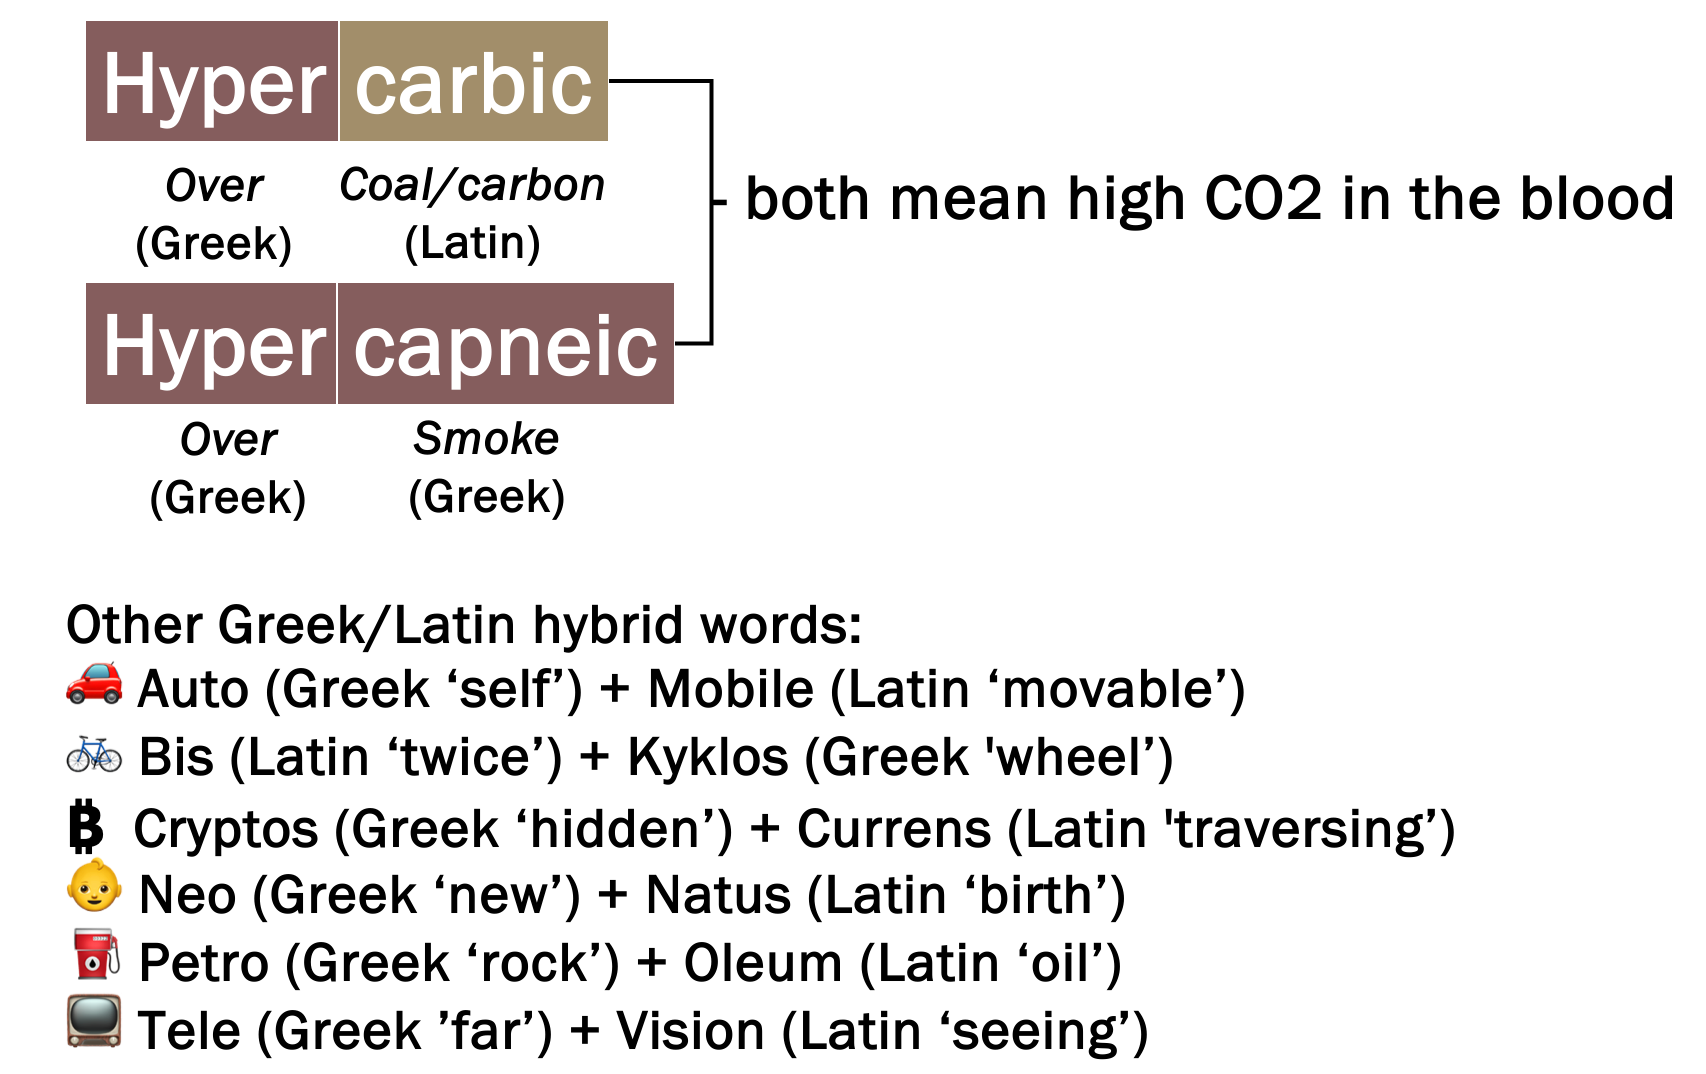
Hypercarbia versus hypercapnia: An exercise in pedantry
The terms hypercarbia and hypercapnia are often used interchangeably to describe an elevated partial pressure of carbon dioxide in blood.
Their linguistic origins are different:
Hyper: Greek for excessive or above normal.
Capnia: Derived from Greek kapnos, meaning smoke.
Carbia: Derived from the Latin root for carbon.
Although some clinicians strongly prefer one term over the other, both are widely understood and accepted in clinical practice. We use terms that are a mixture of Greek/Latin all the time!
Bonus: CO₂ Physiology in the Animal Kingdom
The physiology of carbon dioxide regulation becomes particularly interesting when comparing humans with other vertebrates.
Homeotherms versus poikilotherms
Most birds and mammals maintain relatively stable body temperatures and regulate arterial CO₂ within a fairly narrow physiological range.
Humans typically maintain PaCO₂ around 35–45 mmHg.
However, in ectothermic animals such as reptiles, arterial CO₂ may vary substantially with body temperature.
Alligator physiology
A classic 1978 study examined gas exchange and blood acid-base physiology in conscious American alligators at different ambient temperatures.
When temperature increased from 15°C to 35°C:
PaCO₂ increased from approximately 11.8 to 23.2 mmHg.
Arterial pH decreased from approximately 7.635 to 7.385.
Minute ventilation, oxygen consumption, and CO₂ production increased.
These changes were consistent with temperature-dependent regulation of acid-base physiology in ectothermic animals.
This provides an interesting parallel to the ICU, where fever increases metabolic demand and CO₂ production, potentially making ventilation more difficult in patients with limited ventilatory reserve.
Diving mammals: The ultimate CO₂ retainers
Marine mammals have evolved remarkable physiological adaptations that allow them to tolerate prolonged periods without ventilation.
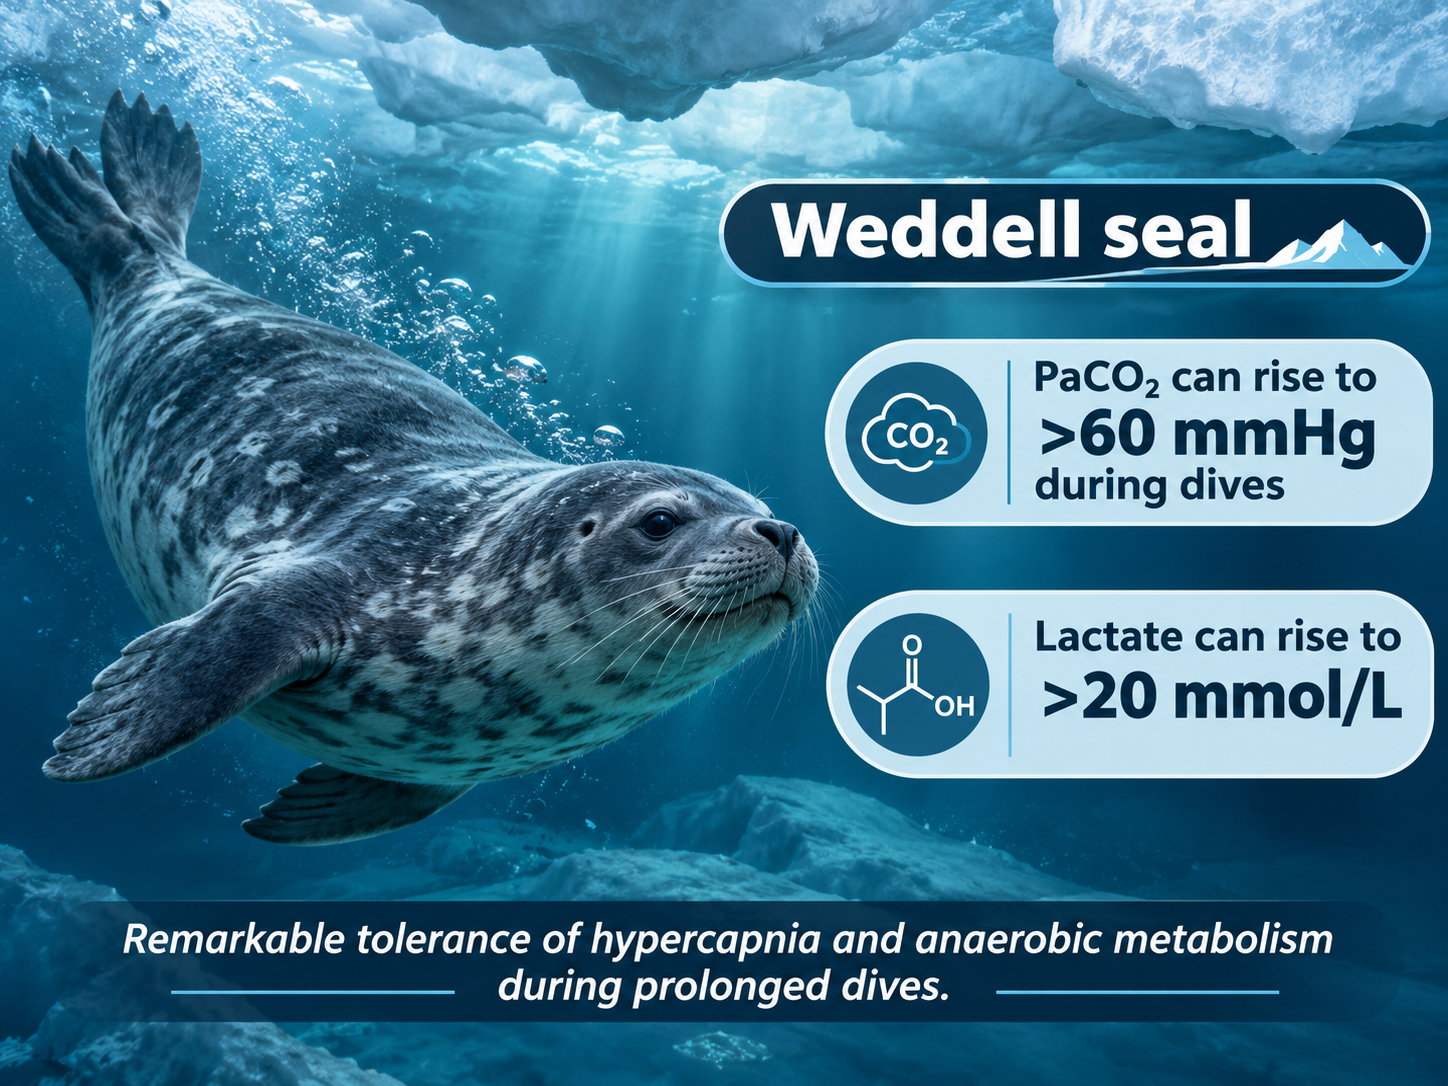
Weddell seals
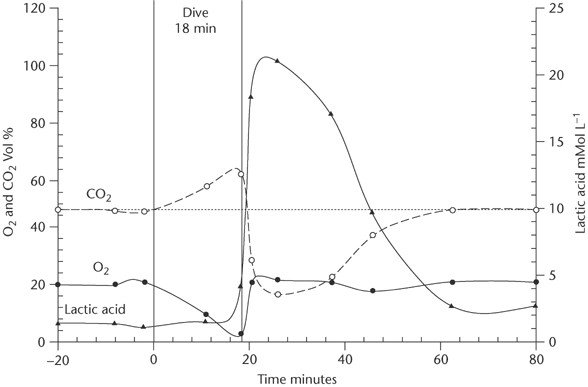
Weddell seals can remain submerged for prolonged dives, during which their pulmonary gas exchange is interrupted and circulating gases undergo substantial changes.
Studies of free-diving Weddell seals have demonstrated:
Profound reductions in arterial oxygen tension during prolonged dives.
Increasing arterial CO₂ tensions.
Changes in circulating hemoglobin concentration.
Remarkable physiological adaptations involving oxygen storage, blood redistribution, and splenic contraction.
One landmark study documented arterial oxygen tension falling as low as 18 mmHg shortly before surfacing following a 27-minute dive.
Manatees
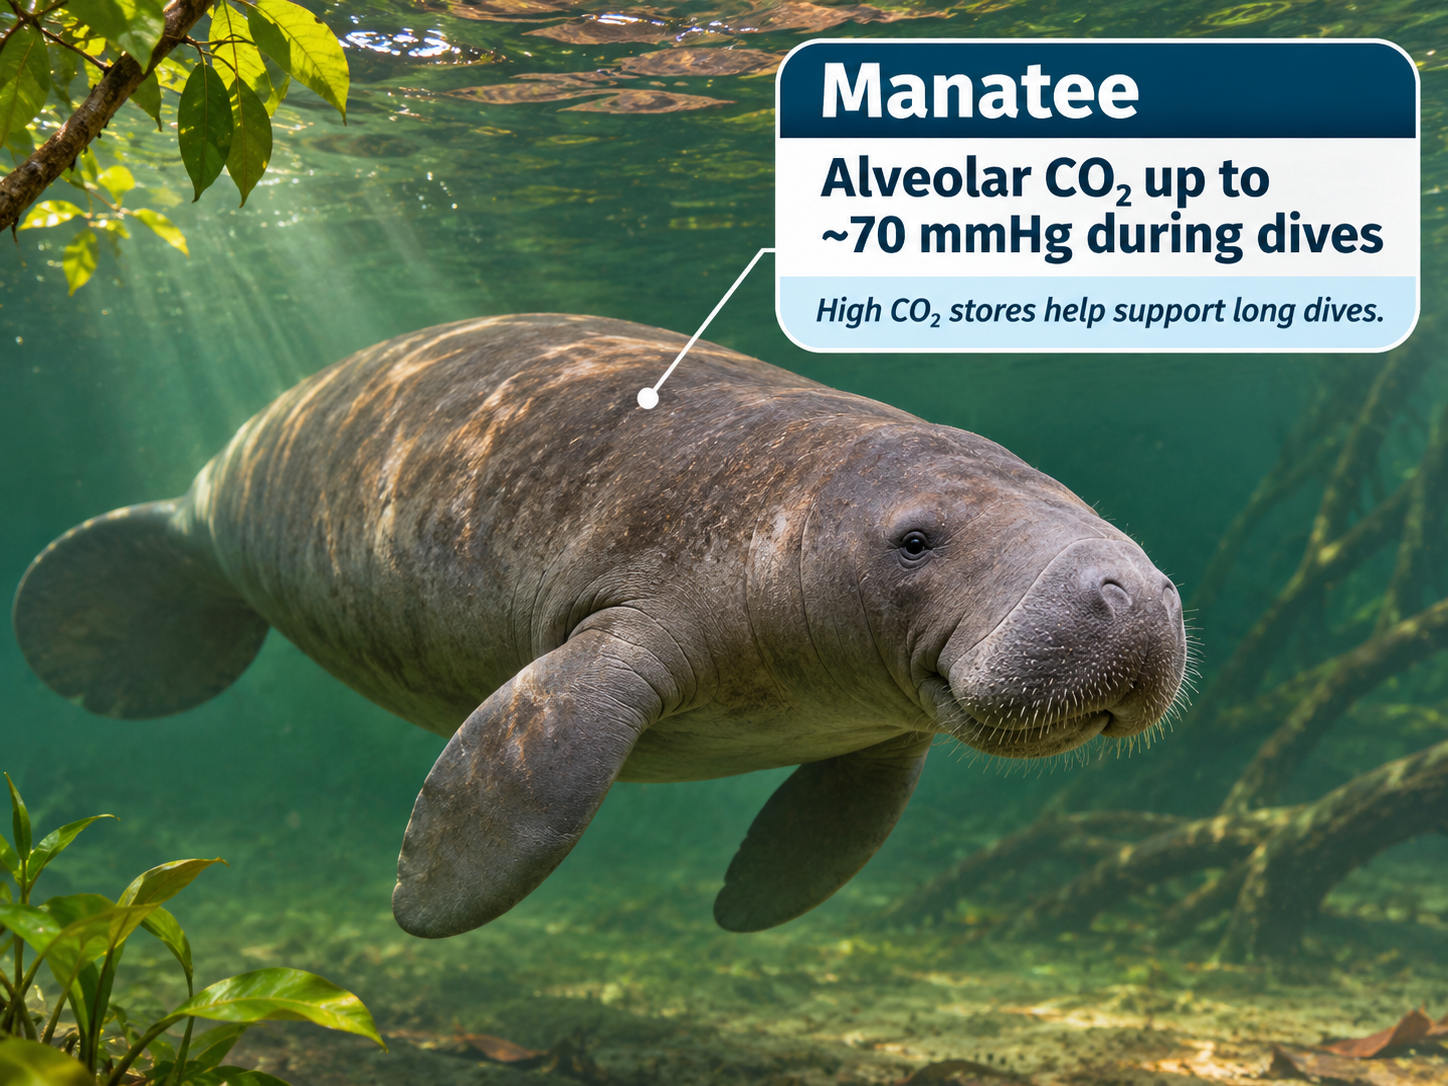
Manatees provide another interesting example of adapted respiratory physiology.
Studies in Amazonian manatees have demonstrated the ability to tolerate dives exceeding ten minutes, facilitated partly by a low metabolic rate and substantial CO₂ storage capacity.
Their alveolar CO₂ changes during dives are influenced by their breathing pattern, metabolic rate, and gas-storage characteristics.
Reference: Heart rates and gas exchange in the Amazonian manatee in relation to diving.
These diving adaptations provide a reminder that CO₂ tolerance, ventilatory drive, and gas-exchange physiology vary enormously across species.
Key Takeaways
Capnography is much more than an intubation confirmation tool. It provides valuable information about airway patency, ventilation, perfusion, and metabolism.
Waveform capnography is preferred over colorimetric CO₂ detection, particularly for confirming and continuously monitoring endotracheal tube position in critically ill patients.
Pulse oximetry does not directly monitor ventilation. Capnography can identify apnea or respiratory depression before significant oxygen desaturation occurs.
ETCO₂ is useful during cardiac arrest. It can help assess pulmonary blood flow during CPR and identify possible ROSC, but should never be used alone to determine when to terminate resuscitation.
Changes in ETCO₂ have multiple possible explanations. Always consider CO₂ production, pulmonary perfusion, and alveolar ventilation.
PaCO₂ and ETCO₂ are not interchangeable. A widening arterial-to-end-tidal gradient can indicate worsening ventilation-perfusion relationships or pulmonary blood flow.
The Bohr and Enghoff equations are not identical. Neither should be confused with simply substituting ETCO₂ for mixed expired CO₂.
Waveform morphology provides important physiological clues. Obstructive waveforms, biphasic tracings, curare clefts, cardiac oscillations, and elevated inspiratory baselines can all reveal clinically important abnormalities.
ETCO₂ changes during passive leg raising may help assess fluid responsiveness when ventilation and CO₂ production are stable.
Interpret the whole capnogram—not just the number. Integrate its morphology and trends with the patient's physiology and other monitoring data.
References and Further Reading
Airway management and confirmation
Chrimes N, et al. Preventing unrecognised oesophageal intubation: A consensus guideline from the Project for Universal Management of Airways and international airway societies. Anaesthesia. 2022. Full text.
Preventing unrecognized esophageal intubation in the emergency department. Journal of the American College of Emergency Physicians Open. 2023. Full text.
False-positive colorimetric capnometry after ingestion of carbonated beverages. Pediatric Emergency Care. 2009. PubMed.
Procedural sedation and opioid safety
American Society of Anesthesiologists. Practice Guidelines for Moderate Procedural Sedation and Analgesia 2018. Anesthesiology. 2018. Full text.
Saunders R, et al. Patient safety during procedural sedation using capnography monitoring: A systematic review and meta-analysis. BMJ Open. 2017;7. Full text.
McCarter T, et al. Capnography monitoring enhances safety of postoperative patient-controlled analgesia. Full text.
Role of continuous pulse oximetry and capnography monitoring in the prevention of postoperative respiratory failure and opioid-induced respiratory depression: A systematic review and meta-analysis. PubMed.
Cardiac arrest and resuscitation
American Heart Association. Part 9: Adult Advanced Life Support. 2025 AHA Guidelines for CPR and Emergency Cardiovascular Care. Guideline.
CO₂ measurement and physiology
Jaffe MB. Respiratory Gas Analysis—Technical Aspects. Anesthesia & Analgesia. 2018;126:839–845. PubMed.
Carbon dioxide kinetics and capnography during critical care. Critical Care. Full text.
Volumetric capnography: Lessons from the past and current clinical applications. Full text.
Negative arterial-to-end-tidal carbon dioxide gradient: An additional sign of malignant hyperthermia during desflurane anesthesia. PubMed.
Association of Anaesthetists. Malignant hyperthermia. 2020. Full text.
Waveform interpretation and fluid responsiveness
Capnographic illustration of differential lung mechanics. American Journal of Respiratory and Critical Care Medicine. 2018. Article.
Endobronchial intubation and biphasic capnography. Illustrated reference.
Value of variation of end-tidal carbon dioxide for predicting fluid responsiveness during passive leg raising: A systematic review and meta-analysis. Full text.
Comparative animal physiology
Davies DG. Temperature-induced changes in blood acid-base status in the alligator. Journal of Applied Physiology. 1978;45:922–926. PubMed.
Qvist J, et al. Hemoglobin concentrations and blood gas tensions of free-diving Weddell seals. Journal of Applied Physiology. 1986;61:1560–1569. PubMed.
Heart rates and gas exchange in the Amazonian manatee in relation to diving. PubMed.